Use case
Process bottleneck analysis: find where work slows down, and why
Process bottleneck analysis finds the steps where cases wait longest and the detours that add time. Favus (process mining) shows the time between steps from your event logs, and Opus (task mining) shows how the desk work in those steps is done.
Why slow processes are hard to fix
One average for the whole process hides where the time goes, and system logs do not show the desk work between steps.
Averages hide the waits
An end-to-end average does not show which step, or which wait between steps, holds cases up.
Detours go unnoticed
Cases that leave the usual path add time, and a volume report does not show where they turned off.
Systems miss the desk work
Event logs record when a step starts and ends, not the checks and re-keying people do at the desktop in between.
How does process bottleneck analysis work in Optimus Hive?
Map the process, find the slow transitions, break slow cases down, study the desk work in those steps, then compare cases before and after a change.
Map the process from event logs
Upload an event log with a case ID, an activity and a timestamp for each event, and Favus (process mining) draws the process map. Filter any view by date range, variant or minimum frequency.
Find the slow transitions
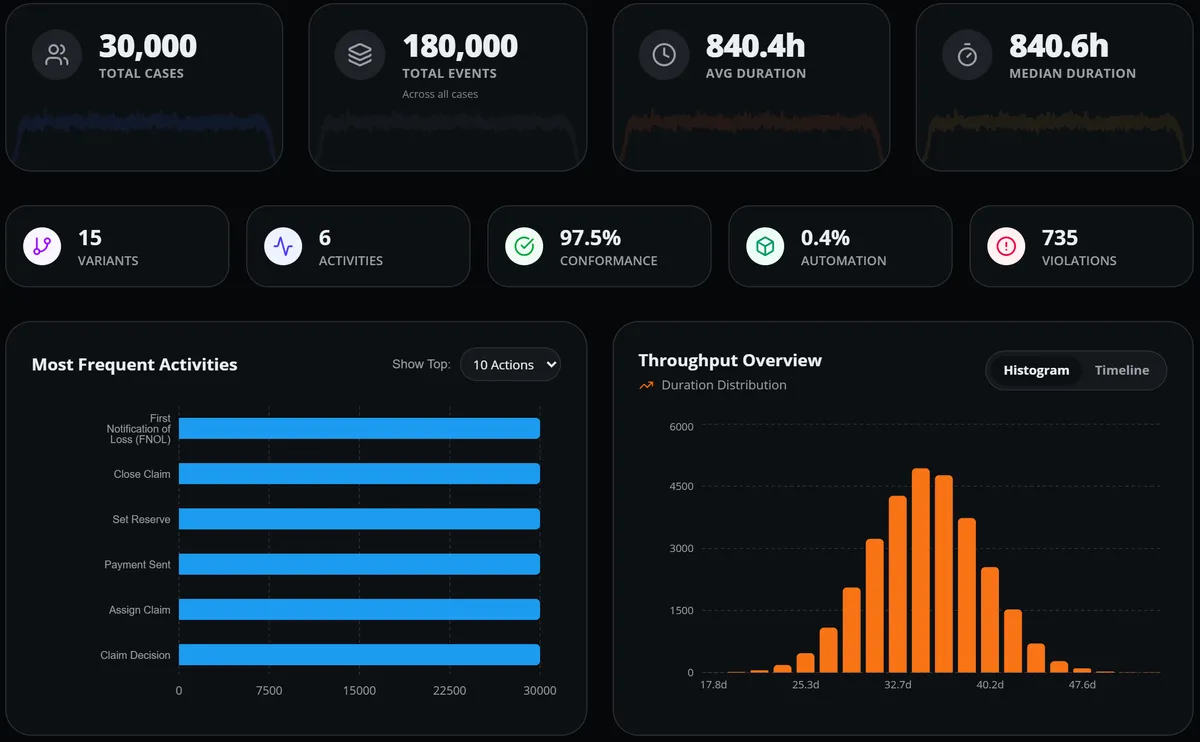
The performance view shows the average time between steps and highlights the slowest transitions. The dashboard adds average and median case duration and a histogram of how long cases take.
Break slow cases down
Split slow cases by vendor, customer type or resource, and place two segments side by side. Favus also counts the cases that leave the most common path and shows how much longer those cases take.
Study and standardize the desk work
Where a slow step happens at the desktop, Opus (task mining) shows the recorded task step by step, with its loops, root causes and lead times. Mark the best run as the approved way of working, and Desktop Copilot guides people through it as an on-screen checklist.
Compare before and after the change
Register the change in Favus and compare cases before and after it against a control group. The result is an observational comparison, not proof of cause or savings.
What you get: the slow steps, and the work inside them
You get the transitions where cases wait longest, the segments that go with slow cases, and a standard method for the desk work in those steps.
The slowest transitions
Every transition in the process map labeled with its average time, and the slowest ones highlighted.
A case-duration profile
Case counts, average and median case duration, and a histogram that shows the spread of case durations.
Detours from the most common path
How many cases take another route, and how much longer those cases run than the cases on the most common path.
Slow segments and rework counts
Which vendors, customer types or resources go with slow cases, and the rework count and workload for each resource.
An approved method for the desk work
The best recorded run of a task, marked as the approved way of working and ready to guide people as a Desktop Copilot checklist.
Deeper analyses for ongoing improvement
Favus also lists process variants, checks cases against an approved model and flags process drift. The model checks, drift monitors and Measured Objectives open in the Optimus Hive web app.
Variant list
Each process variant with the number of cases it covers and its average duration.
Segment and period comparison
Compare two vendors, customer types, resources or time periods on case count and duration.
Checks against an approved model
Check cases against an imported BPMN 2.0 model or a drawn approved model, with the deviating events as evidence.
Drift monitors
Daily monitors raise an in-app alert when paths, handovers or durations shift, and show which segments are associated with the change.
Measured Objectives
Measured Objectives, measured from your process data (Favus), follow average case duration, recorded cost and automation rate, with the events behind each number.
Questions about process bottleneck analysis
Process owners ask these questions about finding and fixing bottlenecks with Favus and Opus.
What is a process bottleneck?
A process bottleneck is a step, or a wait between steps, where cases queue up and slow the whole process down. In Favus, the performance view of the process map puts the average time on each transition, so the longest waits stand out.
Can Favus explain why a step is slow?
Favus shows which segments go with slow cases, not the cause itself. You can break slow cases down by vendor, customer type or resource and compare two segments side by side. Opus then shows how the desk work in a slow step is done, which helps your team find the cause.
Can we see where work gets redone?
Yes: Favus counts rework for each resource, and Opus shows loops inside a recorded task, where the same steps repeat. Use them to find where work is redone, then look at why with the people who do it.
Find your bottlenecks in a demo
Request a demo with one slow process in mind. We'll show where Favus finds the waits, and how Opus shows the desk work in those steps.