

Opus: how people do the work
Opus is task mining software that records how people work on Windows desktops, so you know what each task involves and costs.

Favus (process mining)
Favus is process mining software that turns system event logs into process maps, so you see how end-to-end processes run. Favus shows variants, cycle times and deviations from the main path.
How Favus turns event logs into a process map and shows where time is lost.
Figures in the animation are illustrative.
Process mining is a method that rebuilds end-to-end business processes from the event data your business systems record. Each event needs a case ID (such as one invoice), an activity and a timestamp.
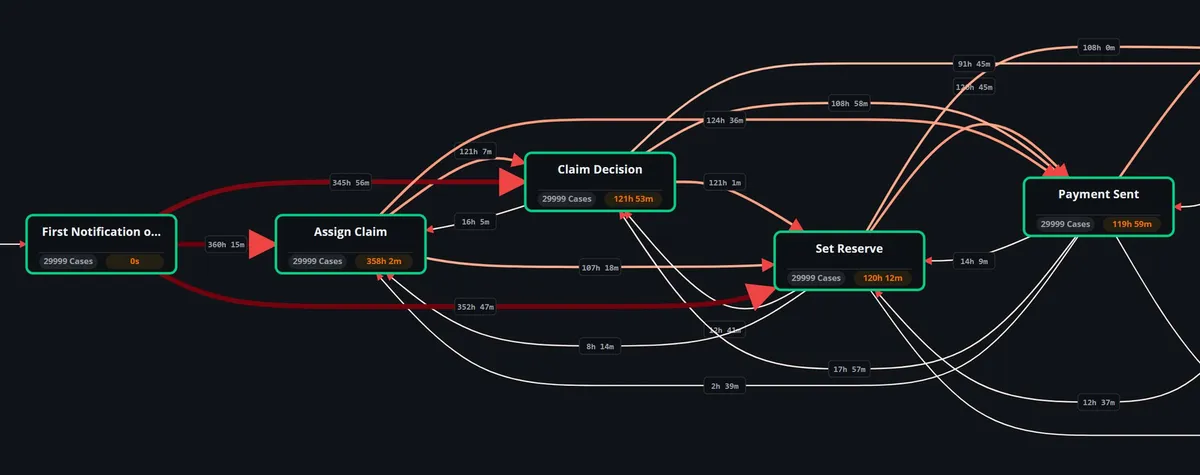
From those three fields, Favus draws the process map. Favus then shows the paths cases take, the time between steps and how many cases leave the most common path.
A documented process shows how work is meant to flow. Process mining shows how each case actually flowed through the systems that recorded it. Before you hand any step to an AI agent, you need that picture: the paths cases take, where they wait and what is already automated.
Favus needs three fields per event from your business systems: a case ID, an activity and a timestamp. From them, Favus draws the process map, with frequency and performance views and the most common path highlighted.
An event log is a list of system events, each with a case ID, an activity and a timestamp. You upload the log to a Favus project as a file. Optional fields add detail: resource (who or what performed the step), vendor, customer type and amount.
Favus draws one node per activity and one arrow for each direct handover from one activity to the next. The frequency view shows how many cases take each arrow, and the performance view shows the average time on it. You can filter by variant or minimum frequency, animate the case flow and export the map as an SVG image.
Favus event logs come from your business systems, not from Opus (task mining). Opus records desktop work as its own task data, which does not become a Favus event log.
The same case ID, activity and timestamp records also drive the Optimus Hive Power BI visual, which draws a process flow inside a Power BI report.
Illustrative
| Case ID | Activity | Timestamp | Resource |
|---|---|---|---|
| 4711 | Receive invoice | 2026-03-02 09:02 | Clerk 1 |
| 4711 | Check invoice | 2026-03-02 09:40 | Clerk 1 |
| 4711 | Approve | 2026-03-04 14:10 | Approver 1 |
| 4711 | Pay | 2026-03-05 08:30 | Payment batch |
| 4712 | Receive invoice | 2026-03-02 09:05 | Clerk 2 |
| 4712 | Request correction | 2026-03-02 11:15 | Clerk 2 |
Automated process discovery from event logs and recorded tasks
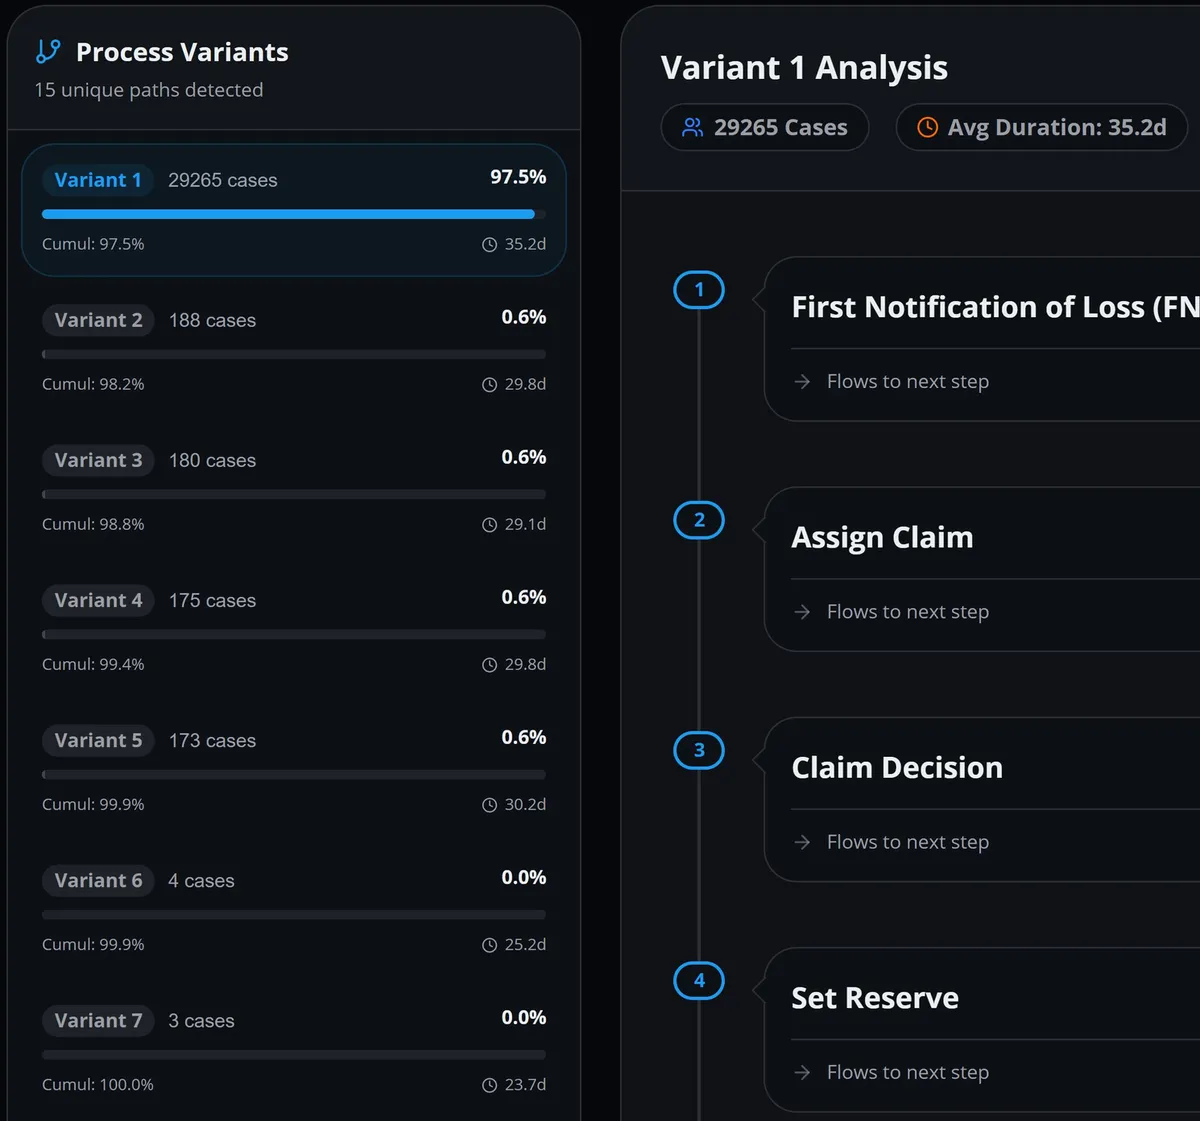
Favus lists the process variants with how many cases each covers and their average duration. Favus also shows how many cases leave the most common path, and what those detours cost in time.
A variant is one distinct path through the process. Favus lists the 100 most frequent variants, each with its case count, share of cases and average duration. Open a variant to see its steps in order.
See what share of cases follows the most common path, and how many take another route. This compares cases with each other, not with an approved model; that check is one of the advanced analyses.
For each deviating variant, Favus shows how its case duration compares with the most common path.
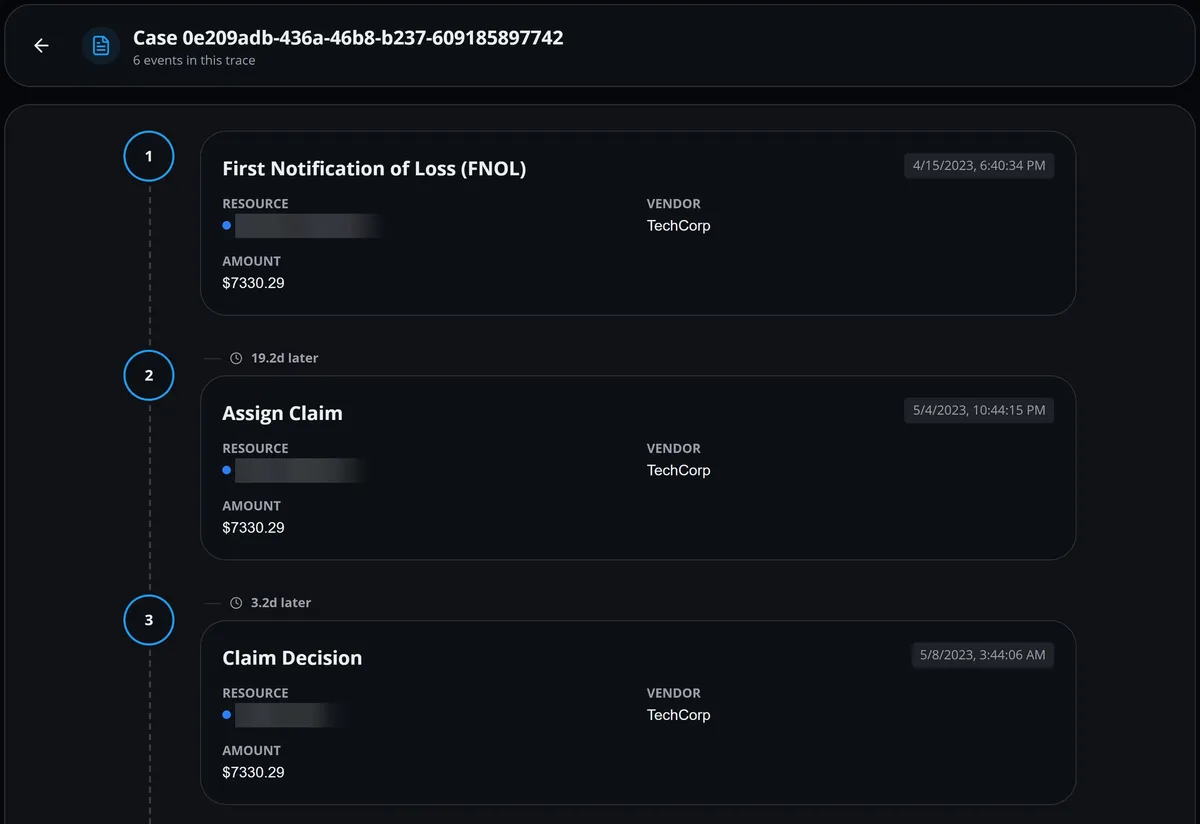
Search and page through the case list, then open any case to see its events in order.
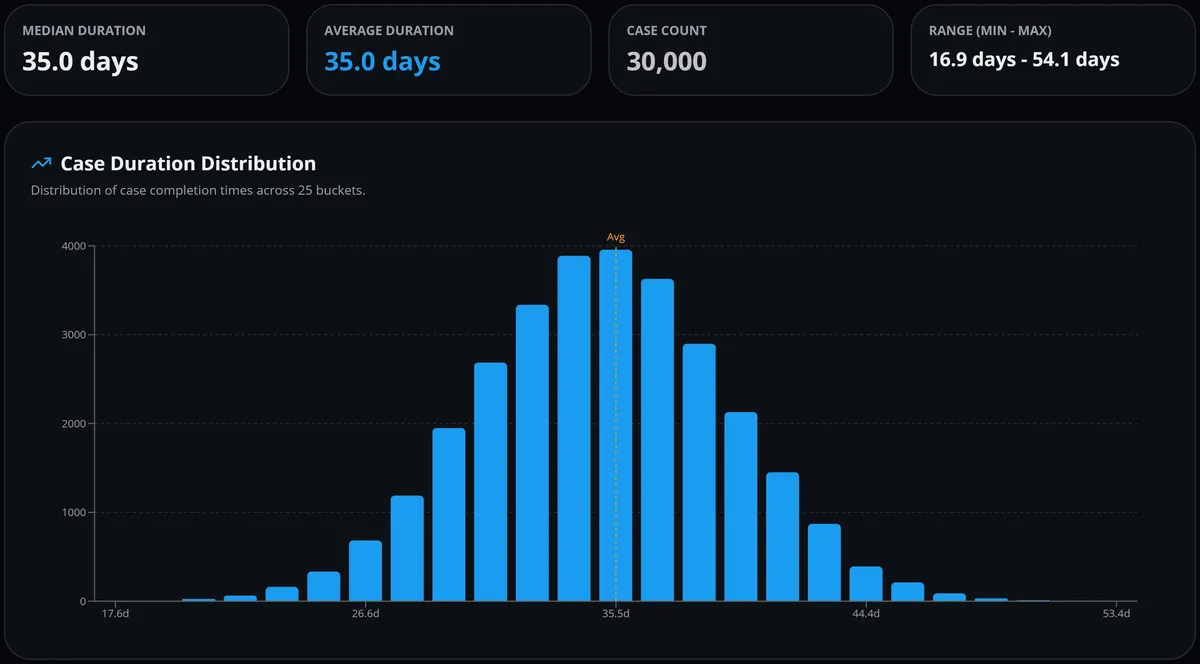
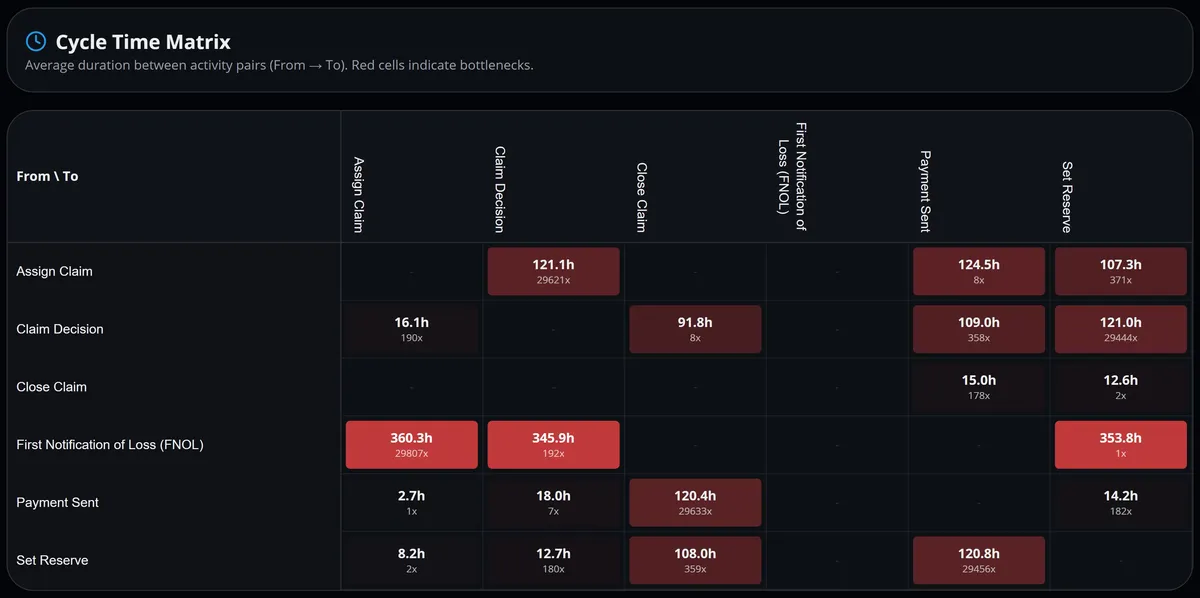
Favus shows where waiting time builds up between activities. The throughput view shows how long cases take from start to end, and the cycle-time matrix shows the average time between each pair of consecutive activities.
A histogram of case durations shows how long cases take from start to end, and a daily timeline shows event volume.
A heat matrix shows the average time between each pair of consecutive activities, so the longest waits stand out.
The performance view puts the average time on each arrow of the process map and highlights the slowest transitions.
Each project opens on its key figures: cases, events, average and median case duration, and the most frequent activities.
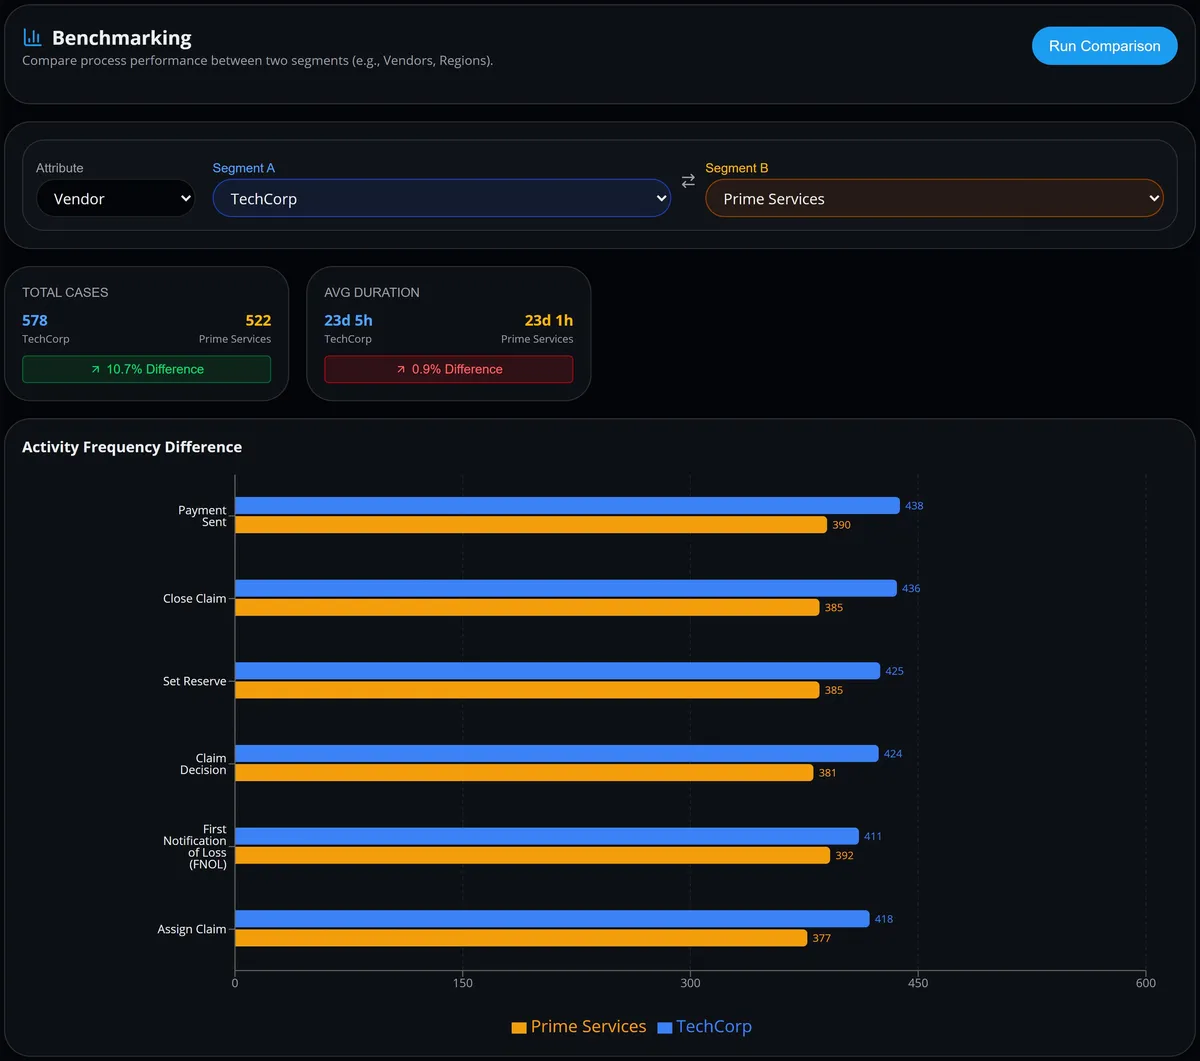
Favus compares vendors, customer types, resources or time periods side by side, and breaks slow cases down by attribute. The results show which segments go with slower cases, so you know where to look; they do not prove a cause.
Compare two vendors, customer types or resources on case count and average duration, and see which activities occur more often in each.
Place the process maps of two segments next to each other to see where their paths differ.
Filter every analysis by date range, variant or minimum variant frequency, or compare one period with another.
Break cases down by vendor, customer type, resource or activity to see which segments are slowest. These views use the optional vendor, customer type and resource fields in your event log.
The Favus handover network shows who passes work to whom, and how often. Favus also shows workload and rework per resource, and how much of each activity automated resources already handle.
A network graph shows which resources pass work to which, and how often each handover happens.
See each resource's cases, events, average handling time and rework count, and filter by activity.
For administrators, Favus adds deeper analyses that open in the Optimus Hive web app. These analyses check cases against an approved model, follow up exceptions, forecast open cases and keep event data current.
Import or export a BPMN 2.0 model (the standard notation for process diagrams), or draw the approved process in an editor. Then check cases against it. Each deviation comes with the exact events behind it, and formal checks report fitness and precision scores.
Open an investigation from a deviation, assign an owner and a deadline, and log each action until it is resolved; every action stays on record. Share a case evaluation with colleagues as viewers or editors, with versioned notes.
Build a standard operating procedure from selected steps of a real case. A reviewed redaction policy is applied, and a second editor must approve each version before it can be exported.
Compare two periods for changes in paths, handovers and case duration, and see which segments are associated with slow cases. Daily monitors raise in-app alerts when the process changes.
Set a service-level (SLA) deadline for an open case. Then forecast its remaining time from similar past cases, as a median (P50) and a cautious (P90) estimate. Forecasts use your approved model to define when a case is complete.
Keep event data current without manual uploads. An administrator connects a system's HTTPS JSON API or an approved SQL Server view, maps the fields and sets a schedule. Each run is logged, with data-quality and gap alerts.
Export one project's process events as an archive with a checksum manifest, which is verified before download.
Set a baseline and a target for average case duration, recorded cost or automation rate. Then track progress measured from your process events, with the events behind each number.
Where they open These analyses open in the Optimus Hive web app and are available to administrators.
Process mining follows each case through its steps in time order, while data mining searches large data sets for patterns. Business intelligence (BI) reports on agreed metrics, such as monthly volumes or costs.
| Aspect | Process mining | Data mining | Business intelligence (BI) |
|---|---|---|---|
| Main question | How do cases really flow from step to step, and where do they wait or deviate? | What patterns or predictions are hidden in the data? | How are our agreed metrics performing? |
| Typical input | Event logs: a case ID, an activity and a timestamp for each event | Large data sets of many kinds | Prepared tables and data models |
| Order of events | Essential: the sequence and timing of steps is what is analyzed | Used only when a method needs it | Usually summarized into totals and averages |
| Typical output | Process maps, variants, cycle times and handovers | Clusters, classifications and predictive models | Dashboards and KPI reports |
| Best suited to | Finding where an end-to-end process loses time or leaves its usual path | Finding patterns or predicting outcomes | Tracking performance against targets |
Favus is step 2 of the Optimus Hive method, between Opus (task mining) and Via (transformation planning). Opus shows how people do the work at the desktop, and Via plans, prices and tracks the move of work to AI agents.
Favus and Opus share one software link: the unified case timeline. The link works once an administrator sets the case-matching rule and employees enter the same case ID your business system uses when they record a task. The timeline then shows the desktop work Opus recorded next to each case's business events.
Nothing flows from Favus into Via automatically; your team brings the findings into Via.
Opus is task mining software that records how people work on Windows desktops, so you know what each task involves and costs.
Your team brings the findings into Via. Via is transformation planning software that plans, prices and tracks the move of work to AI agents, so you decide with a costed business case.
Short answers about Favus: the data it needs, which analyses it includes, how data gets in, pricing and AI.
Favus needs an event log with three fields per event: a case ID, an activity and a timestamp. A case is one run of the process, such as one invoice or one order. Optional fields add detail: resource, vendor, customer type and amount. The resource, vendor and customer-type fields feed the handover, benchmarking and root-cause views.
Favus includes a process map with frequency and performance views, variant analysis and deviation from the most common path. Favus also covers throughput, cycle times, segment benchmarking, root cause by attribute, handovers and a case explorer. Administrators get advanced analyses in the Optimus Hive web app, such as conformance checks against an approved model and case forecasts.
Yes, on a schedule: an administrator can set Favus to pull events from a system's HTTPS JSON API or from an approved SQL Server view. The administrator maps the fields and sets how often each pull runs, in the Optimus Hive web app. There are no ready-made connectors for specific ERP or CRM products. You can also upload an event log file at any time.
No, Favus is commercial process mining software, and pricing is on request. The free trial covers Opus (task mining) only and does not include Favus. Request a demo to see Favus and discuss pricing.
Yes: the evidence-linked process analysis, one of the advanced analyses for administrators, uses AI. The server computes the figures from your process events, and AI writes the answer around them, with its interpretations labeled unverified. The analysis needs an AI provider set up for your organization's workspace, and it is not part of the free trial. The process map, variants, cycle times and other core analyses are calculated without AI.
Request a demo to see Favus turn an event log into a process map, variants and cycle times. We can also talk through the processes you want to examine.