
Automation opportunities
Find the tasks and variants with the highest recorded cost per case, and where cases wait.
Role
Process cost analysis starts from recorded work: Opus (task mining) costs every task case from its duration and the department's hourly or daily rate. Finance leaders see which tasks and variants cost the most, and Via (transformation planning) plans the move to AI agents.
Finance leaders need costs they can trace to source records. Each answer says where the number comes from.
Opus multiplies each recorded case's duration by the department's hourly or daily rate, in that department's currency. The department's overhead percentage is stored but not applied, so the figure is recorded time at the department rate.
Yes. Save any KPI with its source records and definition, and reopen it later with the same numbers. Any data table in Opus can also be exported to Excel.
In Via, each change request carries one-time or recurring cost lines and savings lines. Delivery cost breaks down into role hours, overhead roles and non-labor cost, and Via lists your costliest tasks and processes.
Via builds the business case quarter by quarter, with investment, savings, cumulative cash flow, ROI and payback. Each month, Via compares forecast savings with the realized savings your team enters.
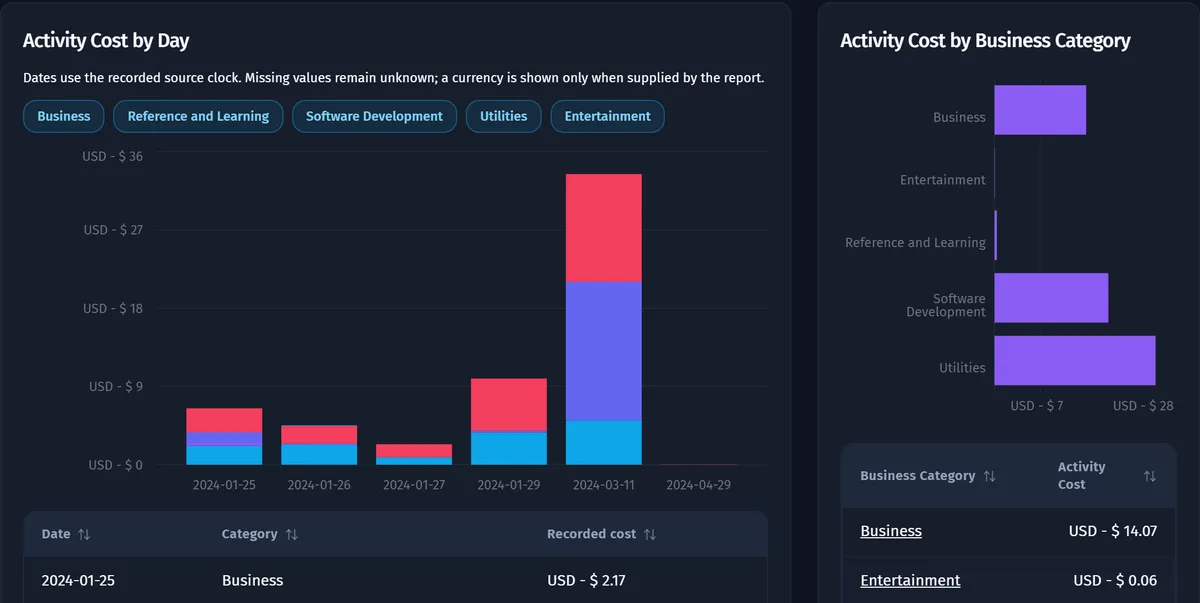
Opus shows recorded cost by application and by business category, and any figure can be saved with the records behind it.
See how much recorded time and cost goes to each application, website and business category.
Compare measured application usage with the number of licensed seats, and with job roles.
Reopen a saved KPI months later and get the same numbers, with the source records behind them.
In Via, the business case shows what the program should return, and value realization shows what your team reports it has returned.
Investment and savings for each quarter, with net and cumulative cash flow, ROI and payback period.
Forecast against realized savings, month by month, from the actual figures your team enters.
Recorded cost, average case duration and automation rate, measured from your process events rather than typed in.
Automation candidates ranked by measured volume, stability and exceptions, against the cost assumptions you state.
Each of these starts from the same costed, recorded work.
Find the tasks and variants with the highest recorded cost per case, and where cases wait.
Keep every change request's cost and savings lines inside one governed program.
Measure the time lost where cases wait between steps, and compare two segments side by side.
Operations, IT and automation leaders ask their own questions of the numbers.
Which of our work should AI agents take on first, and what is it worth?
Delivered by Opus, Favus and Via
Can we roll this out and control it on our estate?
Delivered by Opus
Where do we automate next, and how do we design it?
Delivered by Opus and Favus
How do I build a plan for moving work to AI agents that I can defend and track?
Delivered by Opus and Via
Short answers to the cost questions finance leaders ask.
No: Opus costs recorded time at the department's hourly or daily rate, and the department's overhead percentage is stored but not applied. A daily rate is spread over an eight-hour day. Add overhead in your own cost model if your figures need it.
From your team: each month, your team enters the actual savings and budget spent for each initiative in Via. Via then compares them with the forecast. Separately, Measured Objectives track recorded cost and average case duration from your process events.
Request a demo to see how Opus costs recorded work and how Via lays out the cost of moving it to AI agents.