How can we help?
Main
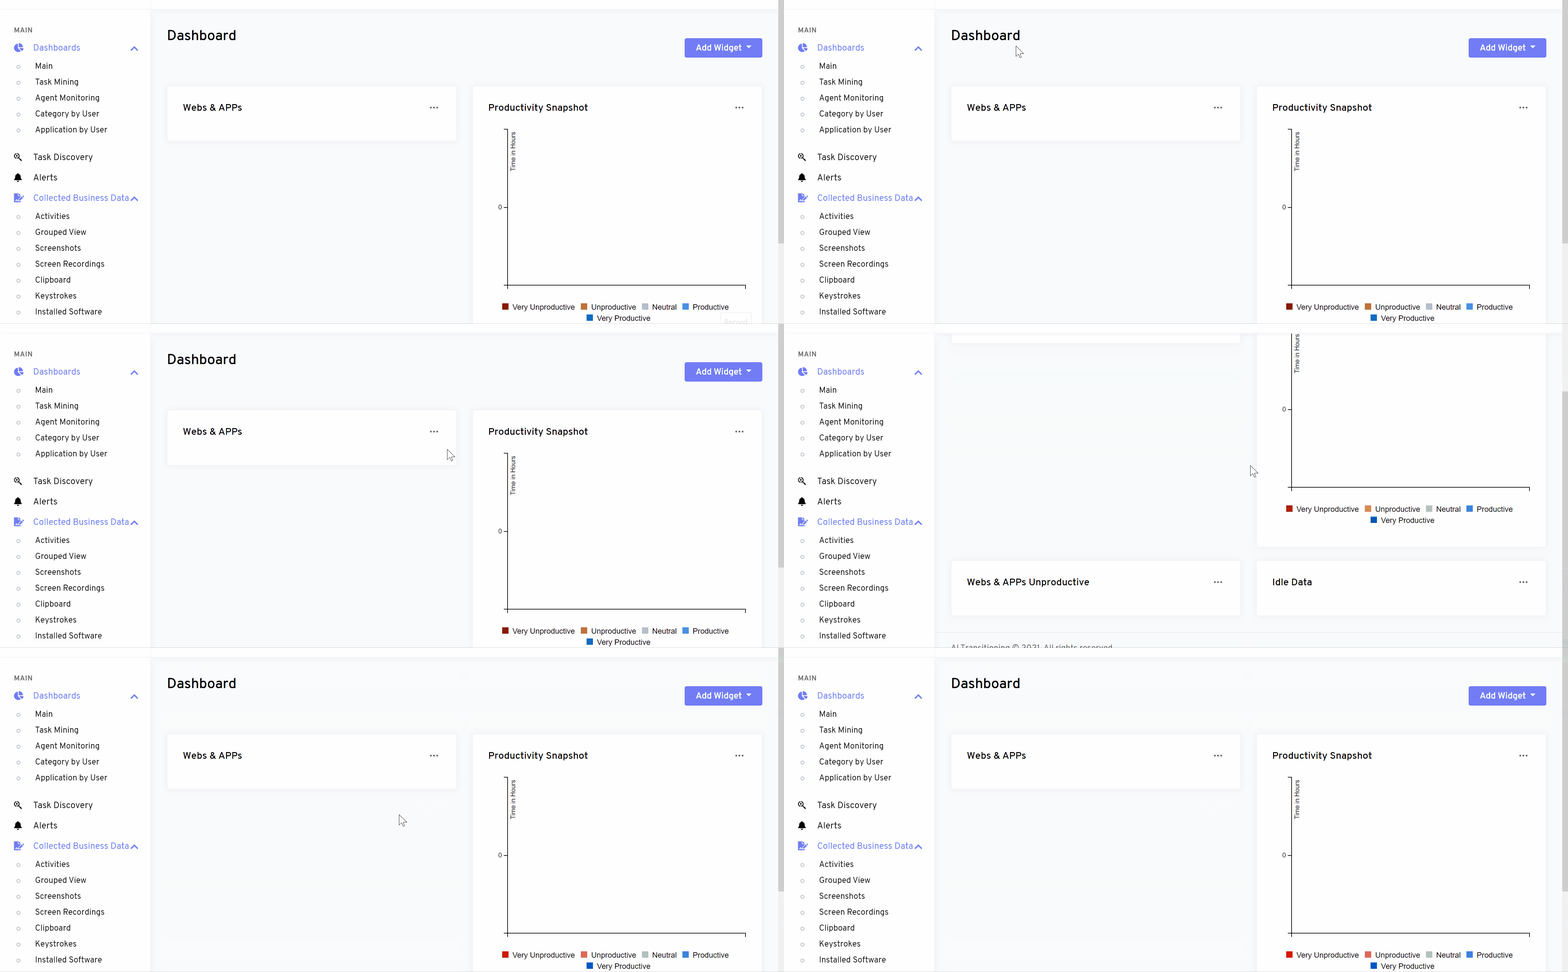
The main window allows you to showcase all the reports without any filtration and you can see all user activity. On the left window, you will see a graph that illustrates if your workforce is either VERY PRODUCTIVE, UPPRODUCTIVE, NEUTRAL, PRODUCTIVE, or VERY PRODUCTIVE. And on the right side, you will see the TOP USED ACTIVITIES that will sort out based on your users’ most used tools/software.

