How can we help?
Applications
How to Find Application Usage Using OptimusHive:
Which employees are utilizing what software and for how long may be determined using OptimusHive. It also shows management where their time is being spent and whether or not their investment in potentially pricey software licensing is paying off. The many ways to evaluate this data with OptimusHive are described today.
Top Applications and Top Websites are two of OptimusHive’s reports that let you examine the technologies that your workers are using. It is crucial to consider both of these categories since office software is becoming more and more online. Many apps aren’t really downloaded onto a desktop, but instead a website which your staff will log onto.
Top-leading applications
This analysis will inform you which workstation-based apps your workers use, how much time they spend using application-based tools overall, and which tools they use the most frequently.
Step by step guide on how to use:
- To access the sidebar, log in to the dashboard. After selecting “Applications” you can view the Top Applications.
- Specify a Name, Category, Subcategory, Business Position, Interface, Data Structure, and Usage (30 Days) to filter by.
- For more details to appear on the right side of this report, click on any application.
Usage: provides a day-by-day analysis of user application usage. It displays which days and how long your team has utilized the specified app. Additionally, it shows when time of day the user spends the most time using the program. Browsers are intentionally left off the list of Top Applications since it is recognized that, even if Chrome may be the most utilized application, it is far more useful to know what users are using Chrome to travel to.
How to add new application:
Though Top Websites report gives an overview of the websites that users of the monitoring service are browsing and for how much time.
How to edit the Website:
To access the sidebar, log in to the dashboard. After selecting “applications” you can view the Top Websites. Click on “edit” icon under “action” column for a specific website.
You are now able to edit the information of any website. Moreover, you can also update or edit the application information including Preferred Name, Category, Subcategory, Business Position, Interface and even Data Structure.
How to view the application status and edit the application:
We get the option to use the OptimusHive’s add-on action in addition to the basic platform to aggregate reports and analyse website and application use concurrently. With the help of this, it is possible to delve even further into data and examine details such as the proportion of users that used a specific website or application, how their weekly usage compares to that of their team, and how usage is trending:
This application status built-in filters allow us to further refine our search results. With the aid of the sophisticated filters provided by program like PowerBI, Tableau, or even Google Data Studio, you can control things like the type of day, which days day of the week, putting a cap on when you should start reporting, and even with the exception of apps that might be common or not pertinent to the type of research you are conducting.
How to view the application status:
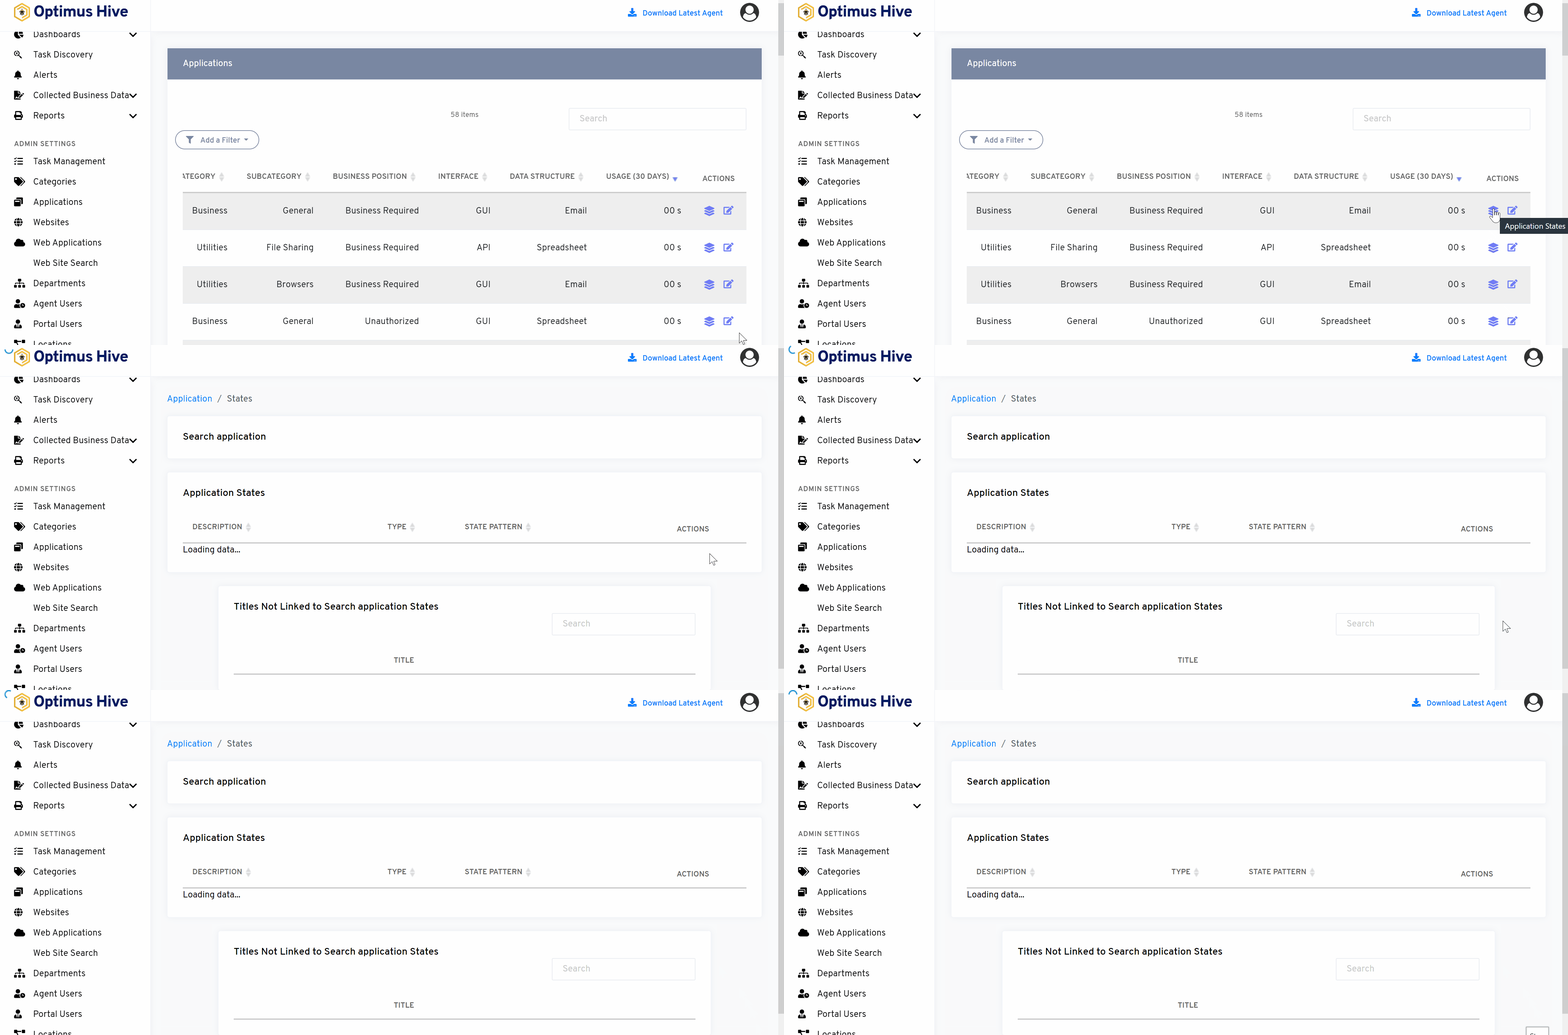
To access the sidebar, log in to the dashboard. After selecting “Applications” you can view the Top Applications. Click on “application status” under “action” column.
You are now able to view the most refined statistical data of each application.

How to edit the application:
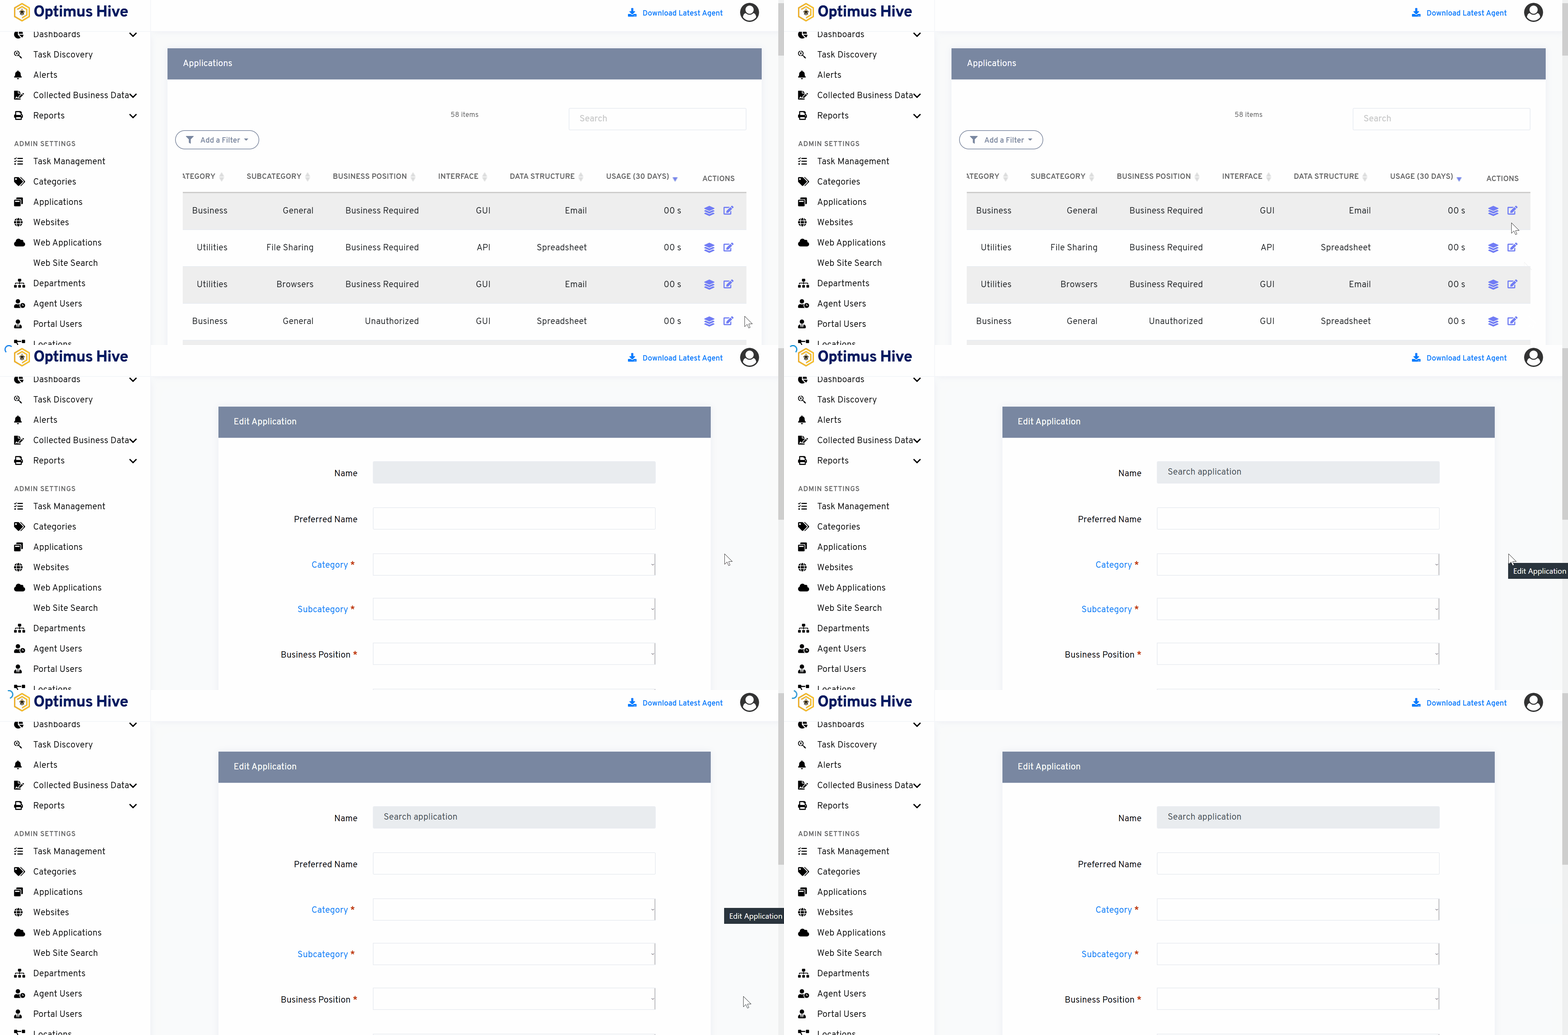
To access the sidebar, login to the dashboard. After selecting “Applications” you can view the Top Applications. Click on the “edit” icon under the “Action” column for a specific application.
You are now able to edit the information of any application. You can also update or revise the application information including Preferred Name, Category, Subcategory, Business Position, Interface, and even Data Structure.

What is each of the FIeld in the list?
- Name The unique name for each application.
- Preferred Name: The preferred name for each application.
- Category: Category associated with each application
- Subcategory: Sub-category associated with each application
- Business Position: Preferred business position for each application
- Interface: Application Interface
- Data Structure: Description of the data.
